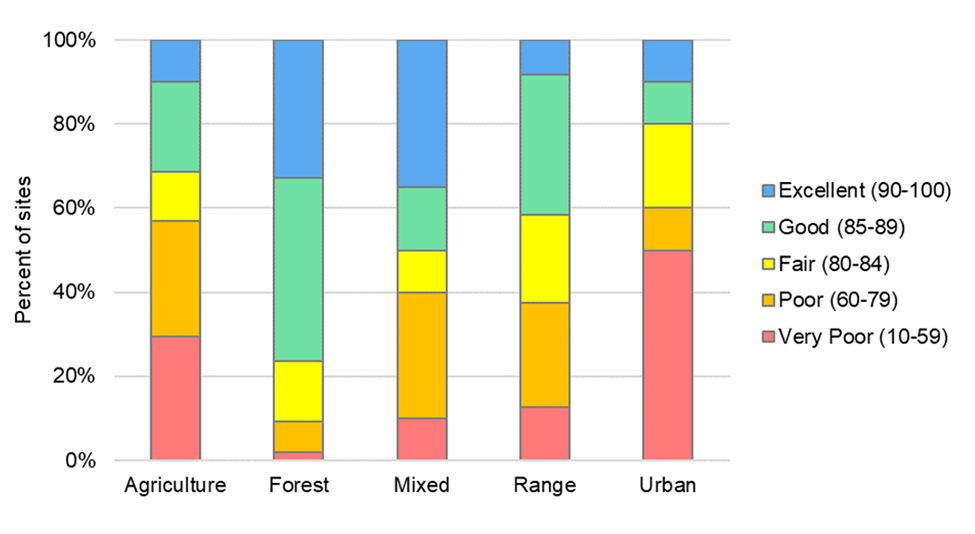
Recently the Oregon Department of Environmental Quality (DEQ) released its annual Oregon Water Quality Index Data Summary which evaluates water quality status and trends across Oregon’s rivers, lakes, streams and other water bodies. The report details results from water samples taken on five different categories of land uses (agriculture, forest, range, mixed and urban) between 2014 and 2023, assigns a score to sample sites ranging from “very poor” to “excellent,” and where applicable, looks at water quality trends over time associated with sample sites.
Nearly 80 percent of water samples taken where forestland was the dominant land use in the five-mile zone upstream of the sample were rated as “excellent” or “good.” Forestland produced the highest percentage of “excellent” or “good” ratings of any land use in the state and also produced the lowest number of “poor” and “very poor” samples of any land use. Samples taken from urban areas produced the highest percentage of “poor” and “very poor” designations.
While the report is not designed specifically to evaluate water quality on actively managed forestland, samples were taken in areas where actively managed forests, including those with recent harvests, were the dominant land use.
For more than three decades, DEQ has evaluated water quality on different land uses. Over that time, the percentage of sites with improving water quality has increased and the percentage of sites with declining water quality has decreased. Of the more than 3,000 water samples taken from forestland, only seven sites showed a declining trend, and all seven of those sites were still ranked as “excellent” or “good.”
Click here to view an interactive map of the water sample locations.

